
PerfView
Collect and view performance data easily
Description
PerfView simplifies performance analysis by allowing users to collect and examine ETW traces and CLR memory dumps in a straightforward interface. It supports detailed investigation of CPU performance metrics, helping you pinpoint inefficiencies and understand system behavior. Whether you're dealing with event traces or heap data, PerfView offers robust tools to visualize and interpret information, streamlining the debugging and optimization process for better software performance.
Screenshots
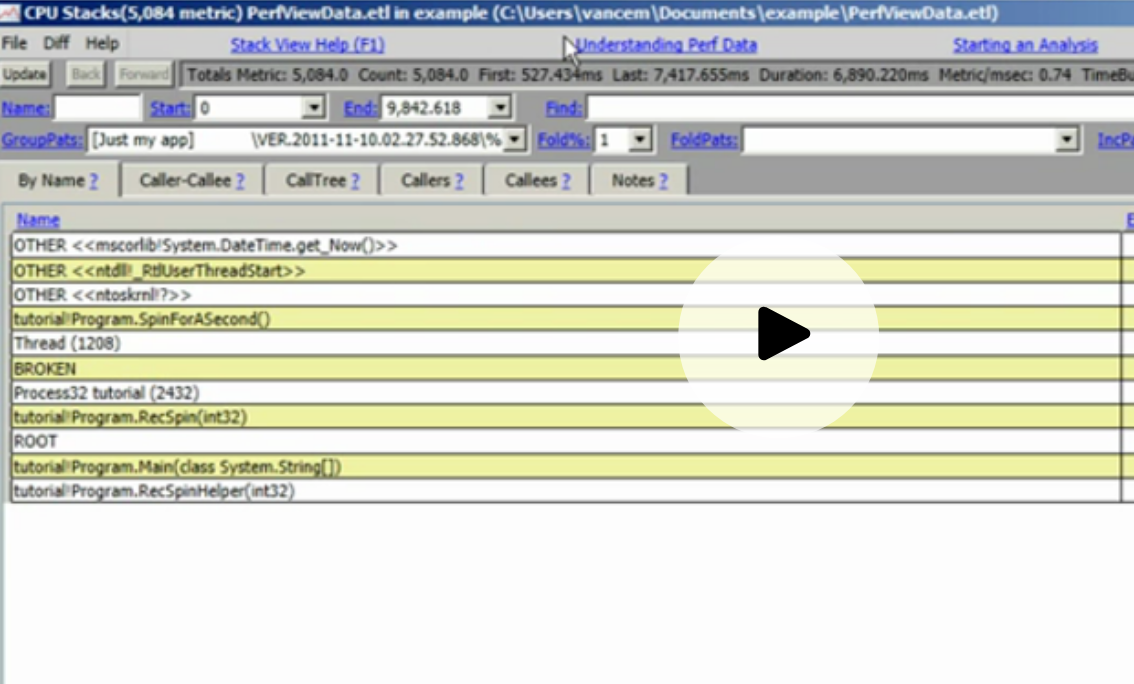
Click to view full size